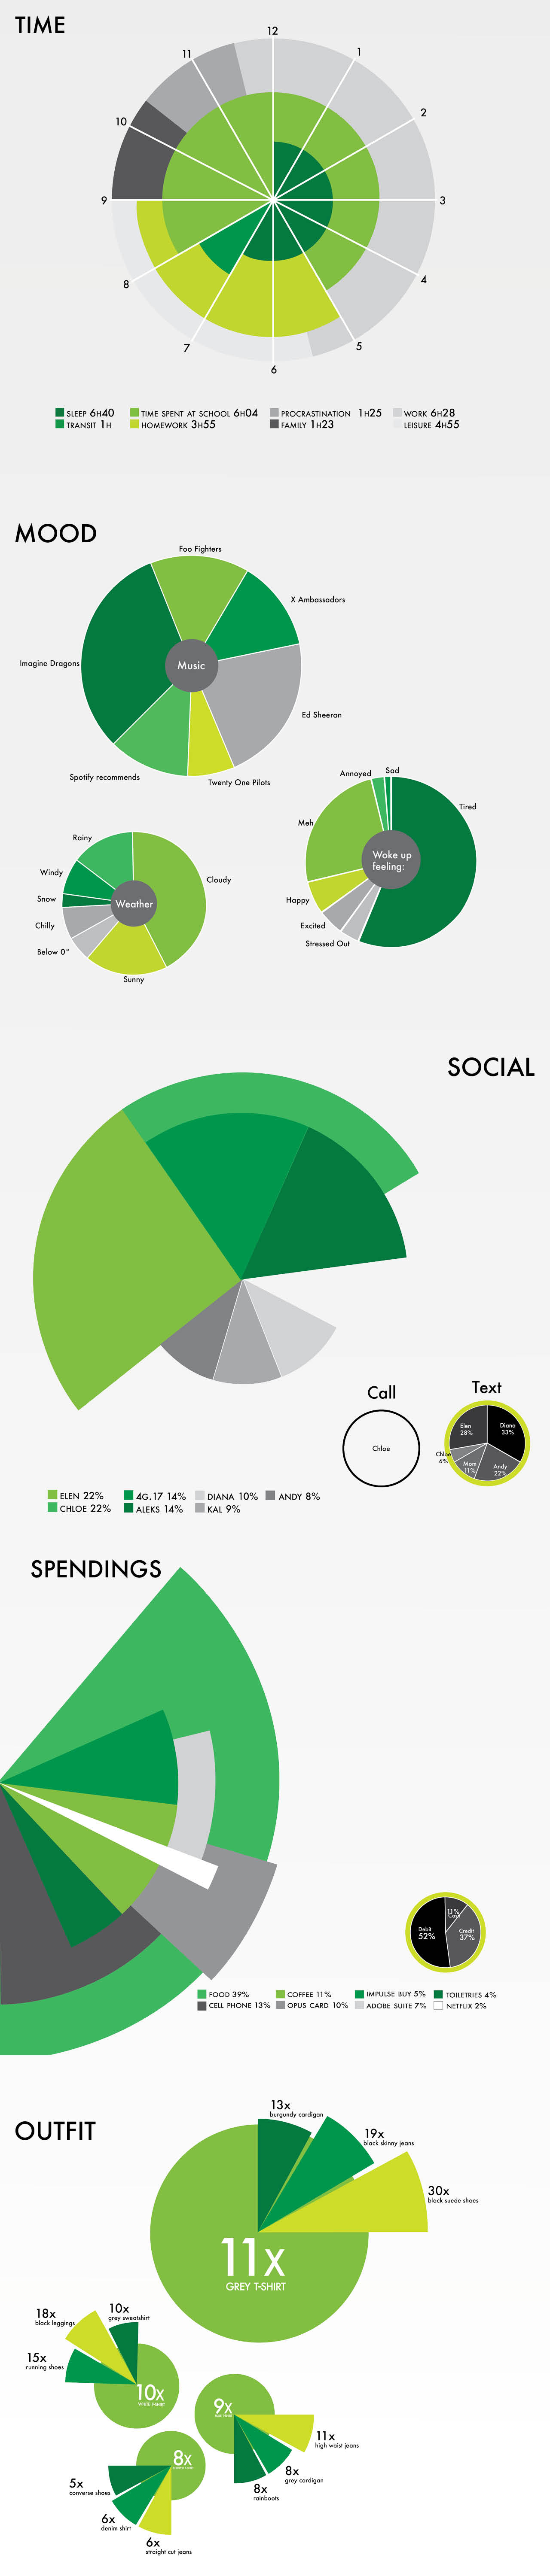
The infographics project was based on our own personal data collected throughout 15 weeks of the semester. Being a personal project revolving on our own life and experiences, the design was to be representative of us; in my case the colour green was emphasized throughout each graph.