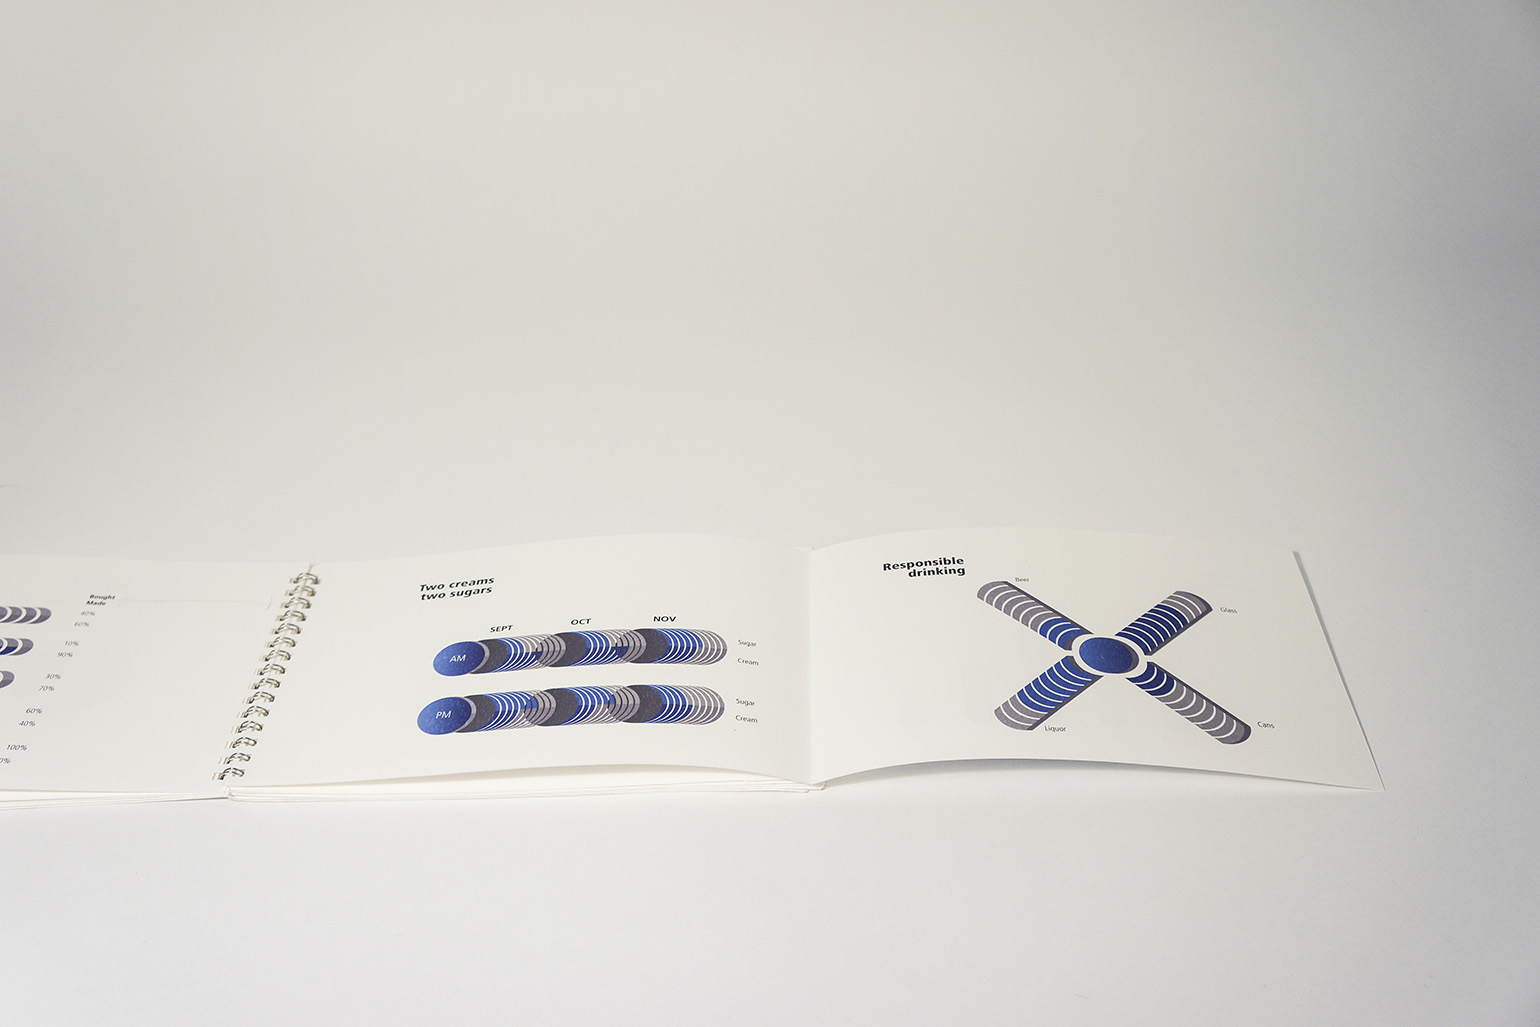
Infographics
This was a first attempt at communicating throught the means of infographics. This projects focused on collecting data taken constantly for 90 days and finding a way to show these statistics with a visual language that is constant in style thoughout each section. It was a good exercise for me to learn to gather infomration and turning it into non-conventional charts.